The application of electron microscopy within the Center for Energy and Environmental Sciences
Metal nano-particles on different supports
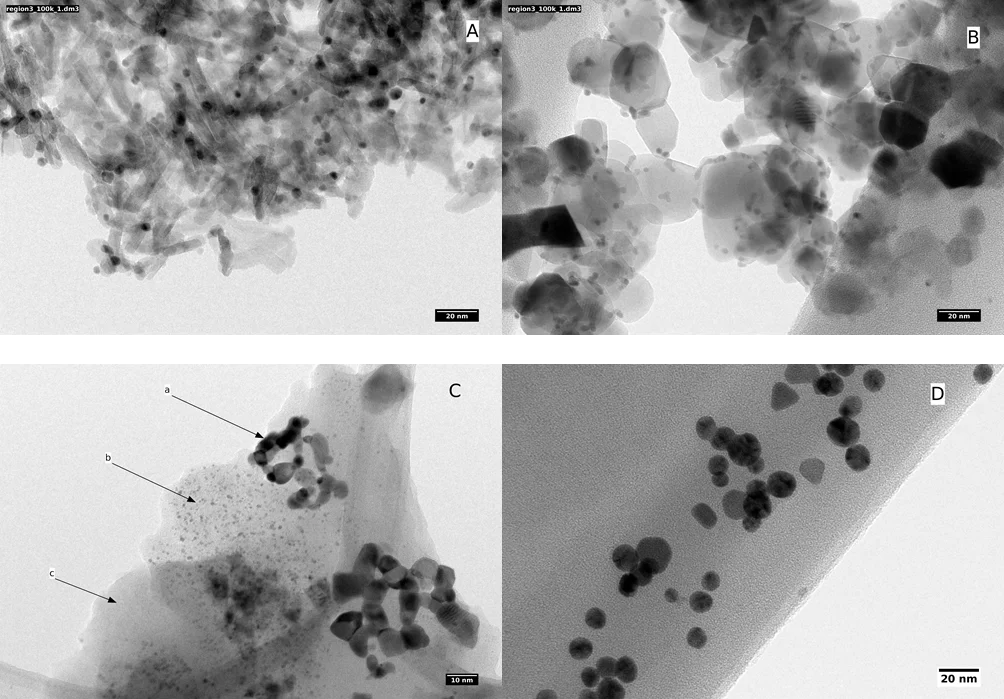
Nano-particles of precious metals such as Pd, Pt or metals such as Ru, Ni, Cu are used as catalyst. They are usually synthesized on oxidic supports such as Al2O3, CeO2, CexZr1-xO2, perovskites such as LaSrTiO5, LaCoO3 or LaFeO3 or on different carbons. Synthesis of the nano particles mostly follows two routes: (I) wet impregnation by nitrate or citrate precursor followed by calcination to form the metal oxides. The catalytically active metal nano particles are finally obtained after reduction in hydrogen. (ii) doping of the support material with the desired metals followed by segregation of the metal nano particles at elevated temperatures under reducing atmosphere. Generally, the second route is preferred as smaller nano particles, down to individual atoms, are obtained. To rationalize the catalytic activity or improve the synthesis the general morphology of the materials as well as the size distribution of the nano particles need to be known. Some examples of recently studied systems are given in the following figure.
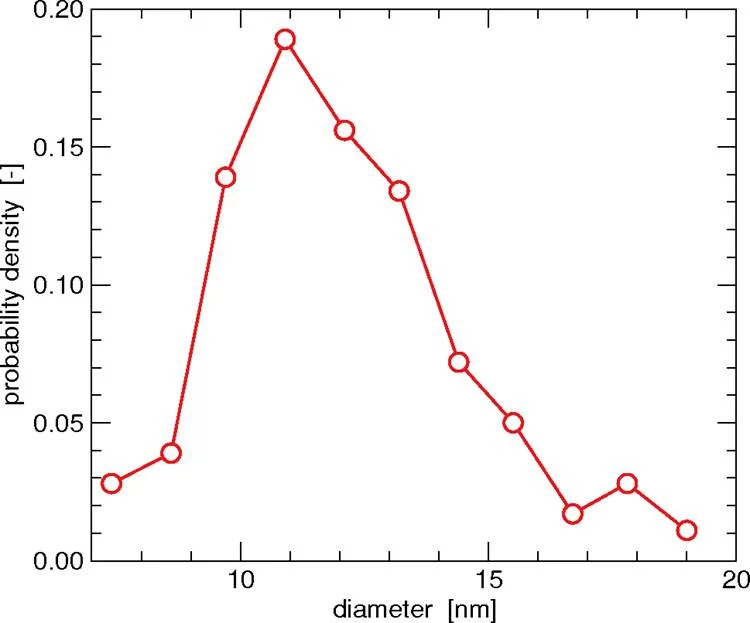
The size distribution extracted from several micrographs of D (155 particles, 10 micrographs) is reported below.
Analysis of fringe pattern [DOI: 10.1111/jmi.12695]
The human eye coupled with the human brain acts as an extremely powerful image analysis system capable of recognizing patterns or structures even in very noisy images. However, human-based image analysis is also easily subjected to bias (we see what we want to see). Thus, it is often preferential to apply computer algorithms, not only because they allow for (fast) batch processing, but also because human bias is avoided.
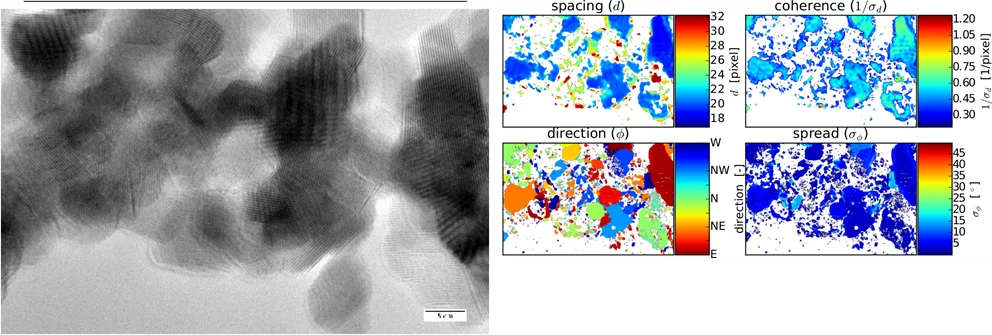
A python module (HRTEMFringeAnalyzer) was developed to evaluate the local crystallinity of samples from high-resolution transmission electron micrographs in a mostly automated fashion. The user only selects the size of a square analyzer window and a step size which translates the window in the micrograph. Together they define the resolution of the results obtained. Regions where fringe patterns are visible are identified and their lattice spacing d and direction φ together with the corresponding mean errors determined.
HRTEMFringeAnalyzer can be used to identify single crystalline grains in polycrystalline samples from continuous regions that exhibit lattice fringes with the same direction. Grains identified in a polycrystalline Zn doped CeO2 sample by HRTEMFringeAnalyzer.
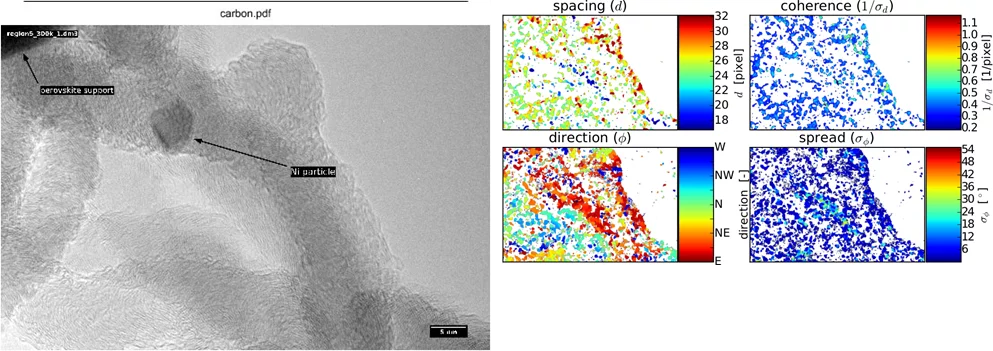
HRTEMFringeAnalyzer was also used to visualize the structure of carbon formed on a Ni/LaFeO3 catalyst operated under coking conditions. Lattice fringes with a d-value of about 0.315 A were observed that identify the structures as pyrocarbons.


