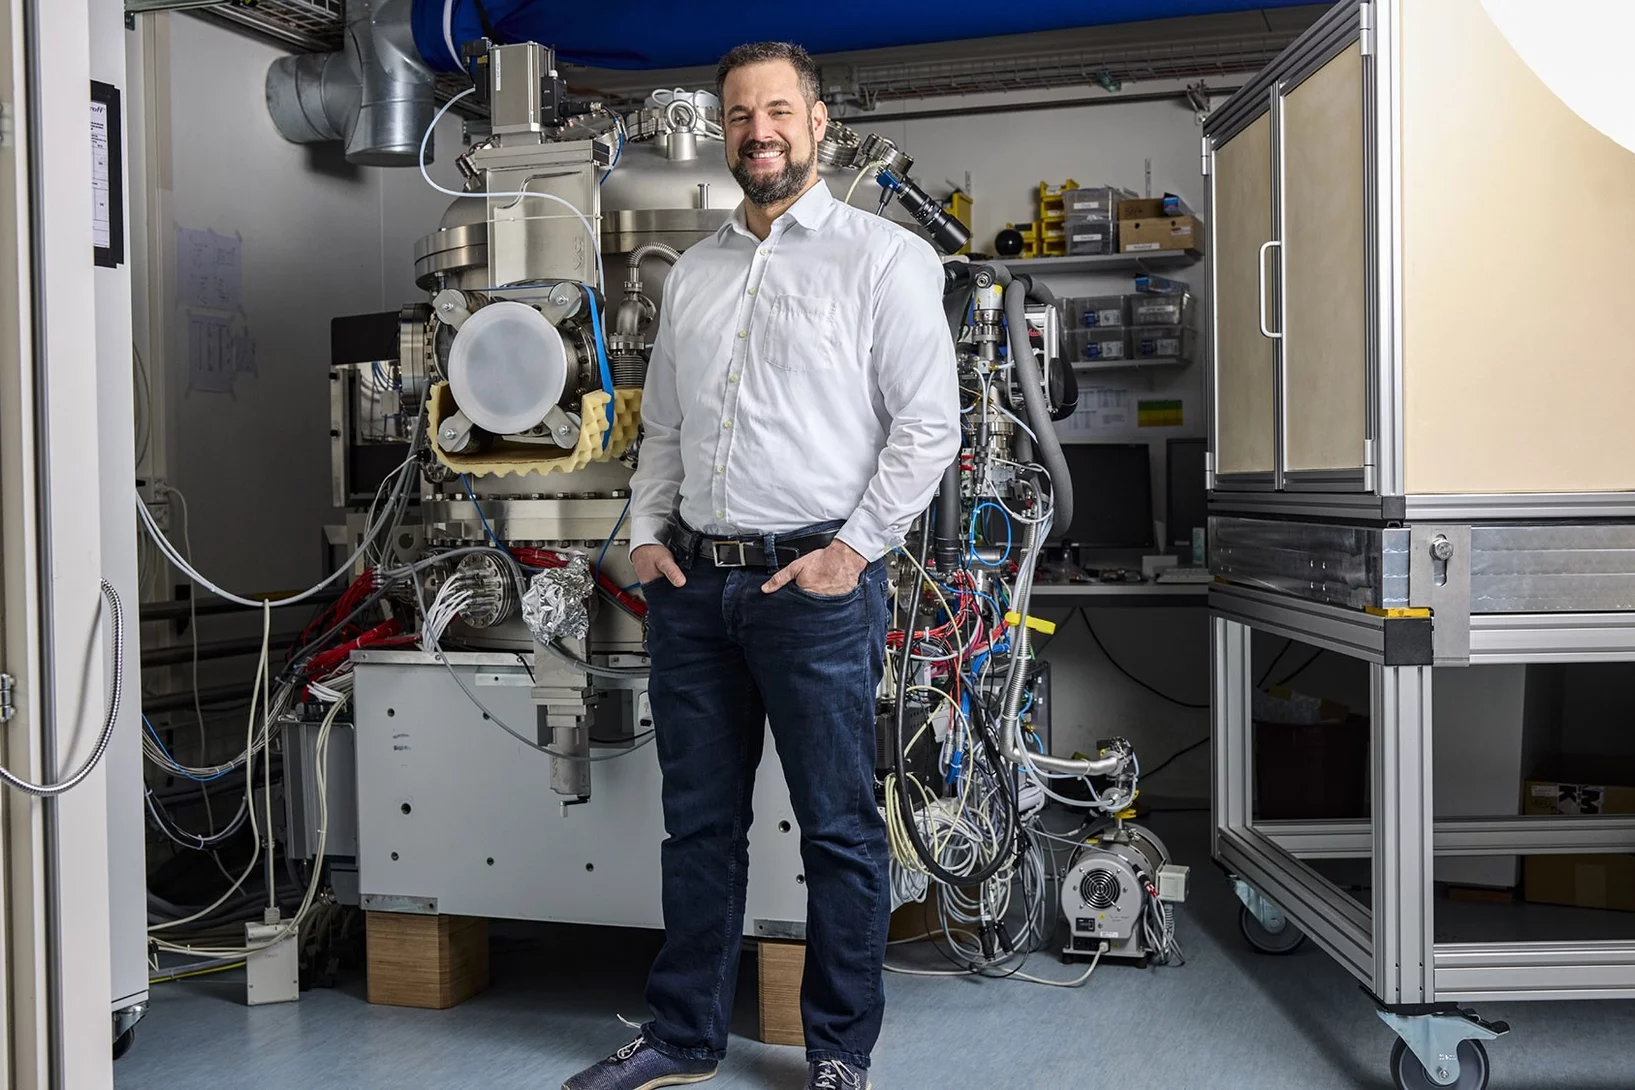
Adrian Wanner aims to map the brain’s architecture. Doing this will allow us to better understand neurodegenerative diseases like Alzheimer’s.

Do you know this situation? You are standing in the kitchen and suddenly don’t remember why you went in there in the first place. Working memory is at fault here. It is supposed to keep information available for us for a period of several minutes. “If it isn’t working properly, it can lead to situations just like this one, where you forget whatever it was you wanted to do,” explains Adrian Wanner, a neurobiologist at the Laboratory of Nanoscale Biology at the PSI Center for Life Sciences (CLS).
In everyday life, situations like this might be unpleasant, but tend to be ultimately harmless. For some people, however, they may indicate a more serious underlying issue, as Adrian Wanner explains: “In the case of Alzheimer’s, working memory is often the first thing to be affected. Long before pathological changes like protein deposits in the brain become clearly visible, patients experience this type of forgetfulness.” Understanding working memory and its structure in detail could thus contribute to better comprehension of the terminal illness Alzheimer’s.
Activity maps and circuit diagrams
In order to reconstruct what exactly happens when the working memory keeps information available, Wanner uses two methods. “First, we create activity maps of brain cells,” the neurobiologist explains. “In these diagrams, the neurons that are activated by a particular action light up in colour.”
The researchers then try to find out how the individual neurons in this area are linked. “It’s like a circuit diagram for a computer,” says Wanner – but with biological synapses instead of electrical connections. Most brain regions and functions have not yet been mapped by way of such a circuit diagram that describes how information is processed: “Does information go directly from point A to point B to point C or are there cross connections or feedback loops in between that move it a step back?”
There are various, often conflicting theories on which paths the brain activates when it processes and then stores information. Adrian Wanner wants to use empirical data to determine which model best reflects reality. He wants to observe which neurons are active during tasks for which working memory is important. He then maps the way in which these neurons are interlinked to create a detailed circuit diagram. “This way, we can track exactly what is happening in the brain at this point in time.”


The working memory at work
For his research, Adrian Wanner works with mice. “In terms of structure and function, their brains are similar to those of humans’,” he explains. “This is why they can also develop forms of dementia and we can analyse how healthy animals differ from sick ones.”
In order to analyse a mouse’s working memory, the neurobiologist sets it a task where the mouse has to remember information for a few seconds. First, the mouse learns how to move around in a virtual environment, similar to a computer game. To do this, the animal watches a screen and runs along a virtual corridor. At the beginning of the corridor, the mouse is shown a specific pattern, for example a checkerboard pattern. It must then remember this pattern.
After a few metres, the corridor forks into a left-hand and a right-hand path. Once the mouse arrives at this point, a pattern is displayed at each path, a line pattern on the right and a checkerboard pattern on the left, for instance. Now, the mouse has to recall: “Aha! There was also a checkerboard pattern at the beginning of the corridor.” If it turns left at the virtual fork, it receives a real reward in the form of food. “It is precisely during this period, when the mouse is no longer looking at the pattern and is running along the corridor, that it must keep the information available – its working memory is active.”
While the mouse is playing this memory game, Wanner and his team are imaging the activity in its brain. By comparing these images to circuit diagrams of the brain, they can determine the rules according to which the neurons are linked in order to keep this piece of information in working memory. “In fact, brain activity differs depending on the pattern that we show the mouse. A checkerboard pattern causes different cells to activate in a different sequence than a line pattern.”
A look into the brain
In order to provide the most accurate information describing which neurons are interlinked, the researchers have to create a high-resolution circuit diagram of the brain. “In one cubic millimetre of brain tissue, there are about 100 000 neurons that are linked by about 700 million synapses along a stretch of 4 kilometres of ‘nerve cables’,” Wanner explains. Neurons’ cell bodies are about 40 micrometres in size and synapses are about half a micrometre. A micrometre corresponds to a thousandth of a millimetre.
Depicting all these tiny and highly complex structures in 3D and high resolution is a major experimental challenge. Electron microscopes achieve the best resolution, but the electrons do not penetrate far enough into the tissue, which means they can at best be used to image the surface of samples.
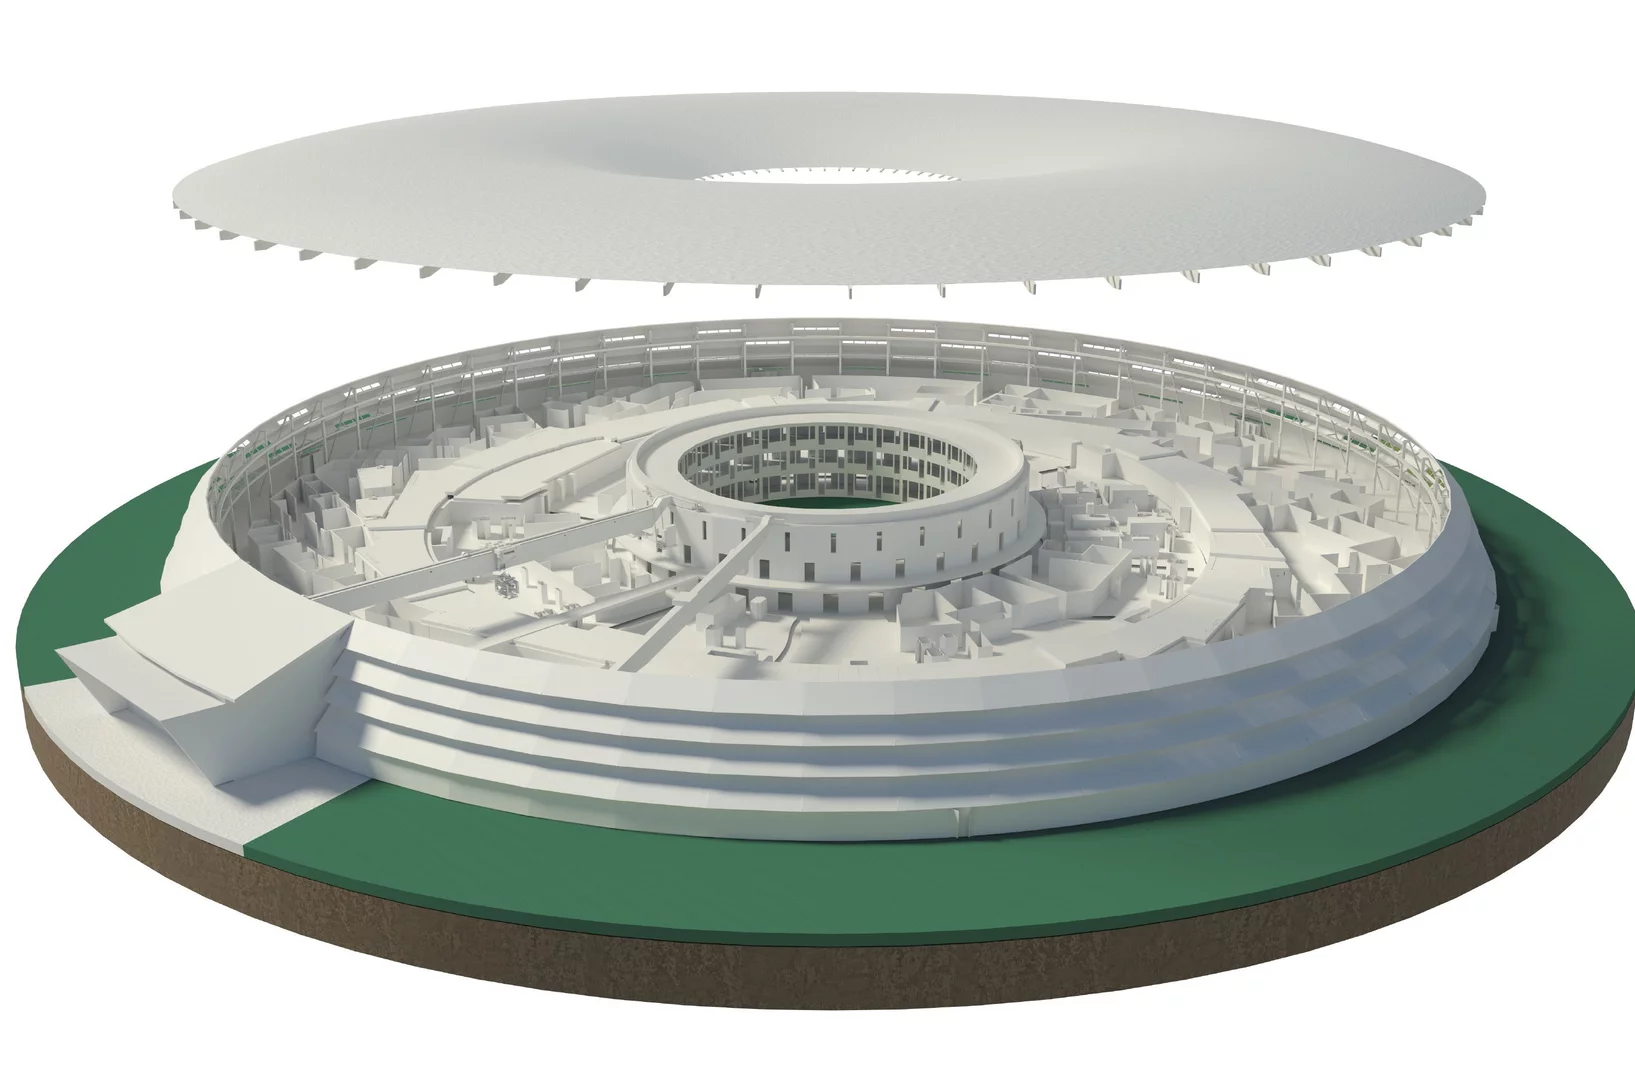
Wanner and his team therefore analyse extremely thin sections of brain tissue. An automated device called a microtome uses a diamond blade to cut a tissue block into sections and an electron microscope takes a picture of each of the sections. However, these slices are just 30 to 40 nanometres in thickness, which is less than a thousandth of the thickness of a human hair. These exceptionally thin slices are extremely hard to handle; they bend, fold or break.
The resulting tears and folds make reconstructing a circuit diagram very laborious. This is why Wanner and his team worked together with a manufacturer of electron microscopes to develop a device that can also image thicker slices: “Our slices are about ten times thicker than the ones used in the conventional process, which makes them less fragile.”
In order to image the “thick” slices with high resolution despite their size, an ion beam gradually removes thin sections by polishing them off. A new picture is taken after each section until the entire thick slice has been removed and imaged. All the individual images are finally combined to form a high-resolution 3D image.
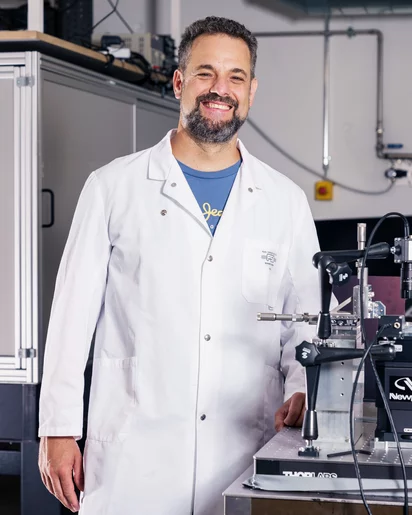
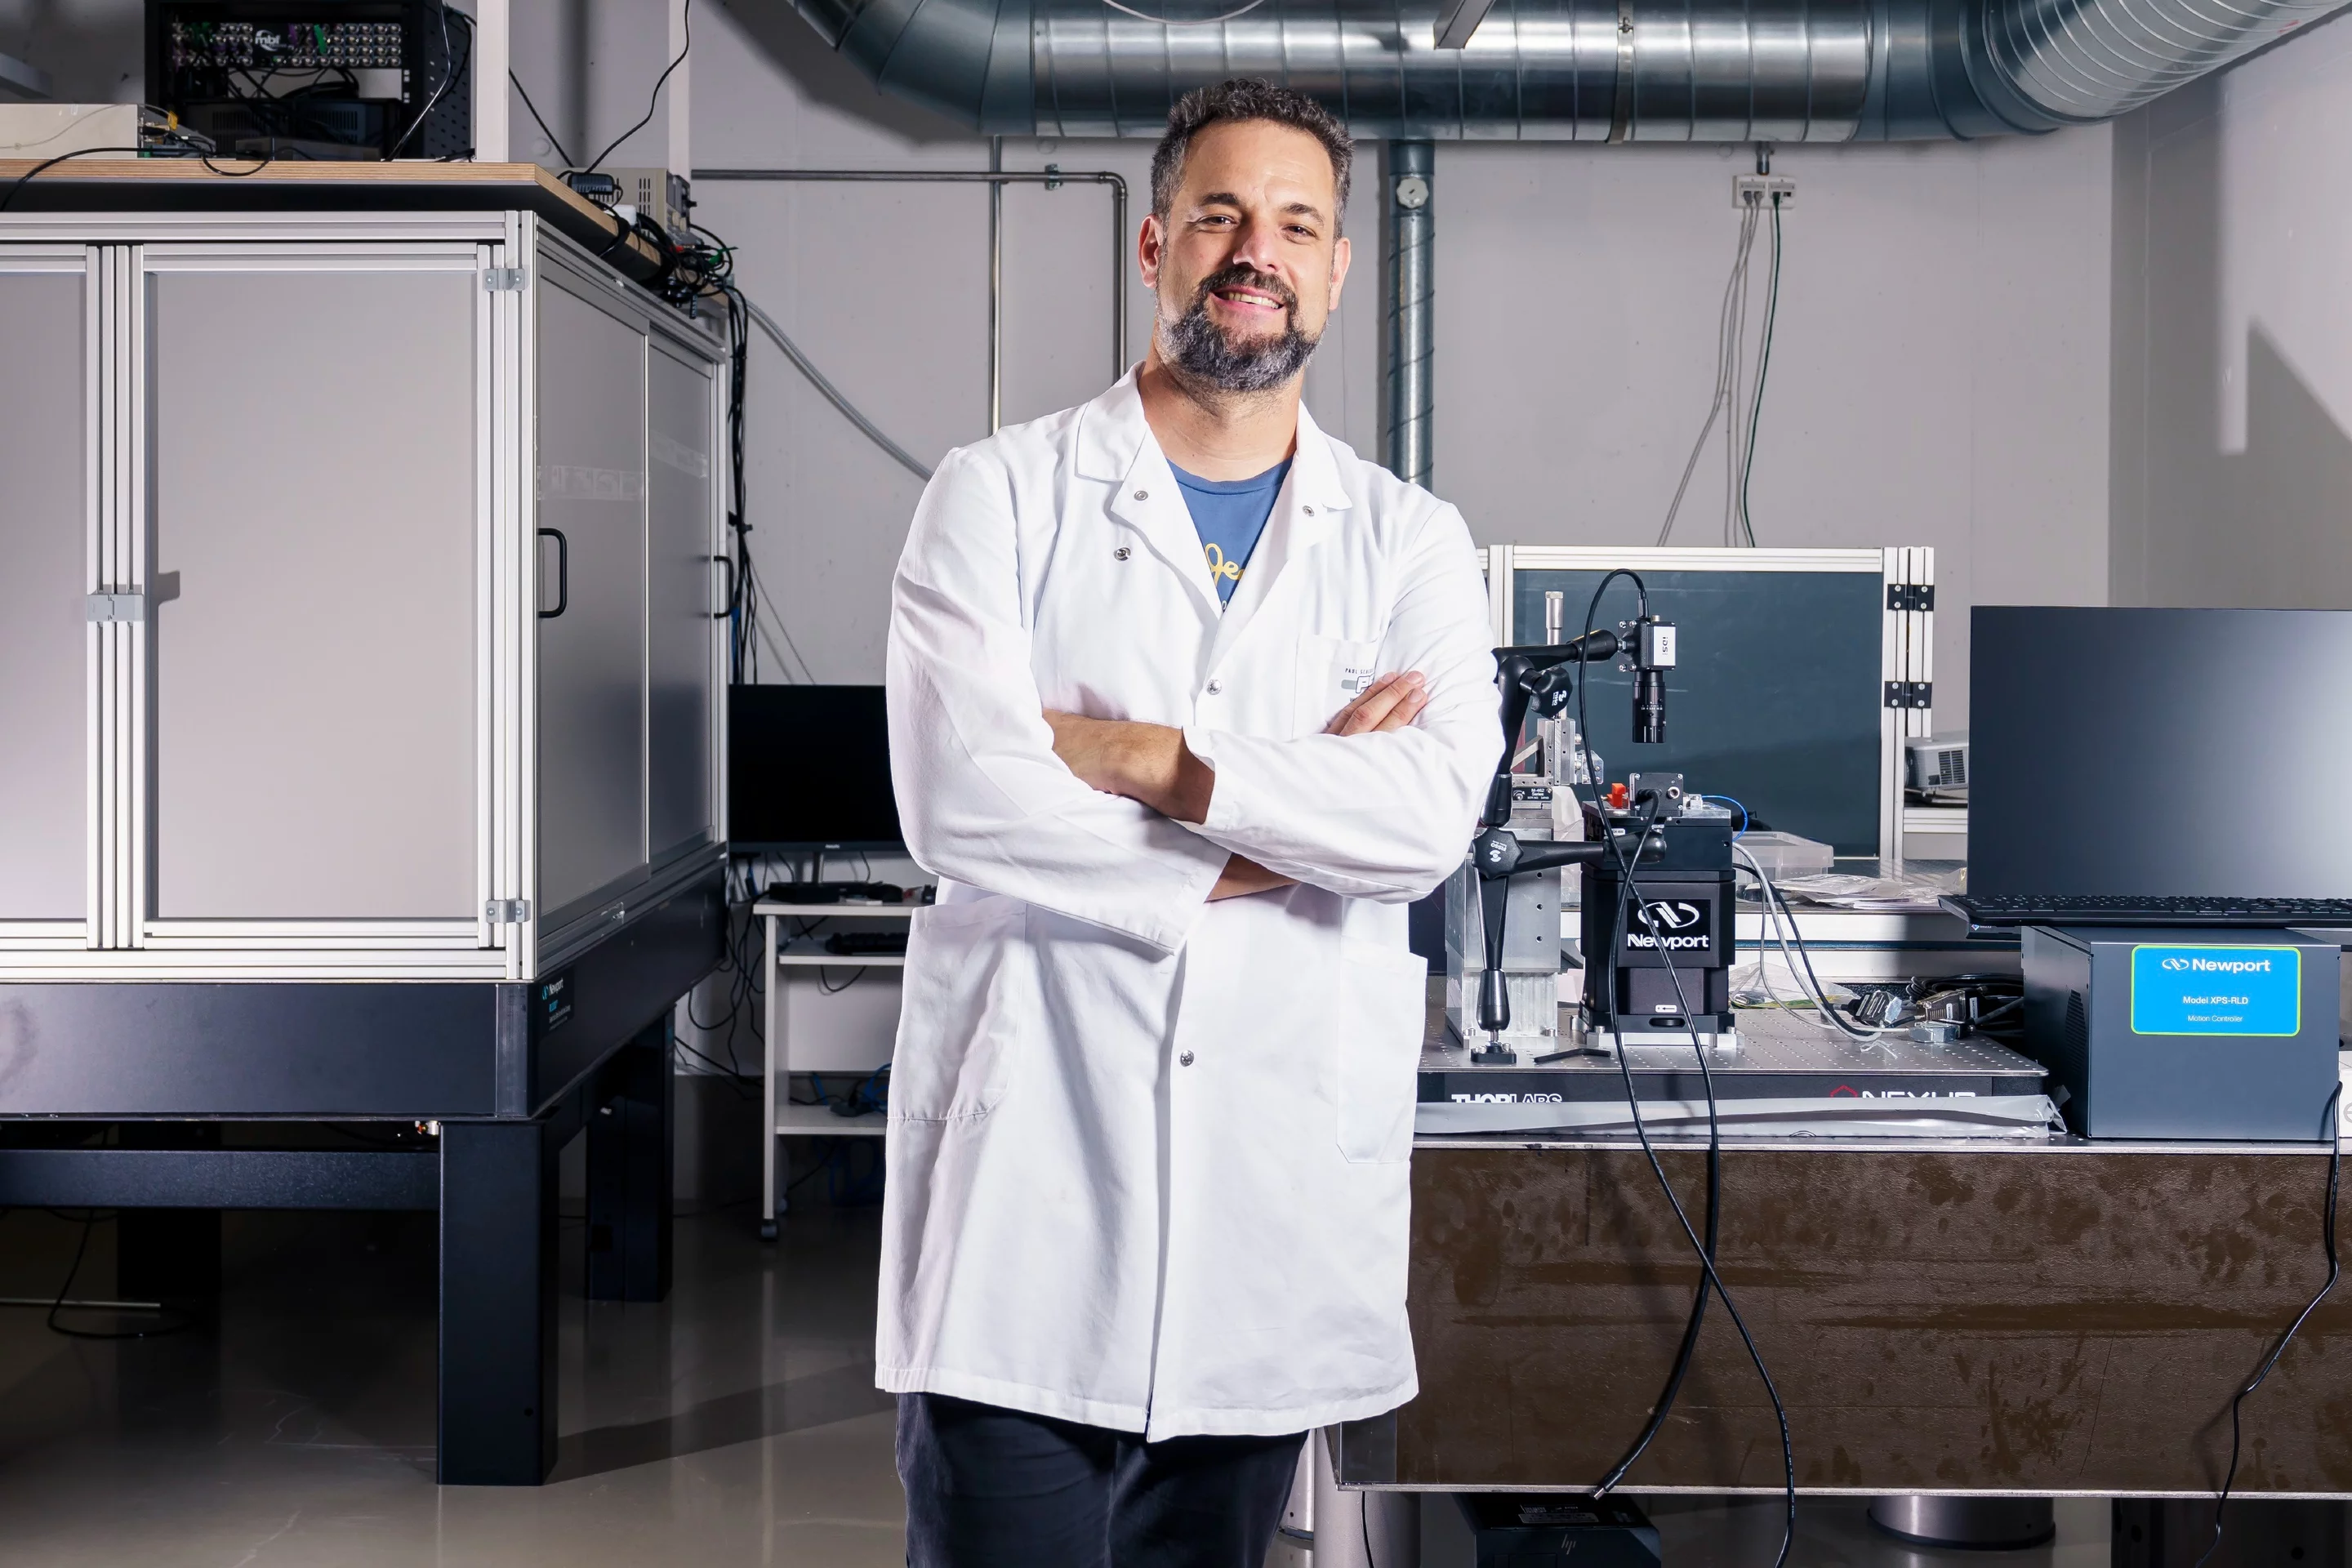
Adrian Wanner studied interdisciplinary sciences at ETH Zurich with a focus on theoretical physics and neuroinformatics. The neurobiologist then completed his doctorate at the Friedrich Miescher Institute for Biomedical Research in Basel and founded the company ariadne.ai, which specialises in the analysis of biomedical images. In addition, Adrian Wanner worked as a CV Starr Fellow at Princeton University, USA. Since September of 2022, he has headed the Structural Neurobiology Group at PSI (www.structuralneurobiology.ch).
Plans for SLS 2.0
Adrian Wanner wants to improve the recorded images further by using new methods. “Hypothetically, X-ray tomography could allow us to abandon sectioning completely and to analyse entire brains, or at least parts of them, in high resolution.” This is already possible for computer chips, but not for brains. In this area, researchers at PSI are achieving resolutions of four nanometres using ptychography at the SLS. “But biological samples cannot withstand the high radiation doses in the SLS at this resolution and are destroyed in the process.”
In order to protect the samples, Wanner and his team are experimenting with new industrial epoxy resins that can withstand over a thousand times more radiation. This has been promising so far. “It would be an absolute breakthrough to be able to just X-ray the whole sample and not have to worry about problems with tearing or folding.”
At PSI, the neurobiologist has found the perfect infrastructure to do this: “The SLS 2.0 is an even better tool we can use. The technology and technical know-how are also the reason why I came to PSI. That’s what PSI is known for, and also what makes it unique worldwide.”