
With ecoinvent, the Paul Scherrer Institute and its partners at ETH Zurich, ETH Lausanne, Empa and Agroscope have been running the world’s leading database for life cycle inventories for over ten years. This kind of database forms the basis for assessing the environmental burden of products and services. The latest ecoinvent version 3 now collects new data in areas such as electricity generation, agriculture, transport, mining and chemicals. In the power sector, which is significant for life cycle assessments, the database now covers over 80 per cent of the global production. And technology that has not been considered thus far such as enhanced geothermal systems is to be included in ecoinvent from now on. The result is more accurate ecological assessments of products and services.

How many CO2 emissions does a solar panel produced in China cause compared to one from Germany? Are gas-fired combined cycle power plants really more environmentally friendly than other fossil technologies? Do electric vehicles actually make sense from an ecological point of view? Decision-makers from politics and industry, but also private consumers who care about climate and environmental protection, are confronted with such questions on a daily basis. The life cycle assessment instrument provides answers by highlighting the impact of products on the environment throughout their entire value-added chain – from the procurement of raw materials to their disposal at the end of their useful life. Databases like ecoinvent form the necessary basis for this kind of analysis: they contain information on how much material and resources many different products and services need and which emissions they entail.
The prerequisite for a meaningful life cycle inventory is detailed and up-to-date information on individual production stages, preferably broken down into production sites and technology. For instance, the generation of one kilowatt hour of electricity from a coal power station leaves completely different ecological traces behind to the same amount of electricity from a wind farm. On the other hand, a coal power station in Western Europe does not contribute towards environmental pollution on the same scale as one in China.
The ecoinvent database offers reliable, regional inventories divided into technology for a large number of products and services. As a non-commercial and completely transparent database, it is utilised by over 4,000 users worldwide. The data stems from the literature, statistics, industry (such as from international organisations like the International Energy Agency (IEA) and the Organisation for Economic Cooperation and Development (OECD)) or meticulously reviewed scientific studies, which guarantees both transparency and top quality.
Strong regional differences in the power sector
As in the past, researchers from the PSI have now revised and extended the corresponding inventory data on electricity production for the latest version 3 of ecoinvent, which means that aspects of the ecological assessment for this crucial industrial sector can now be scrutinised.
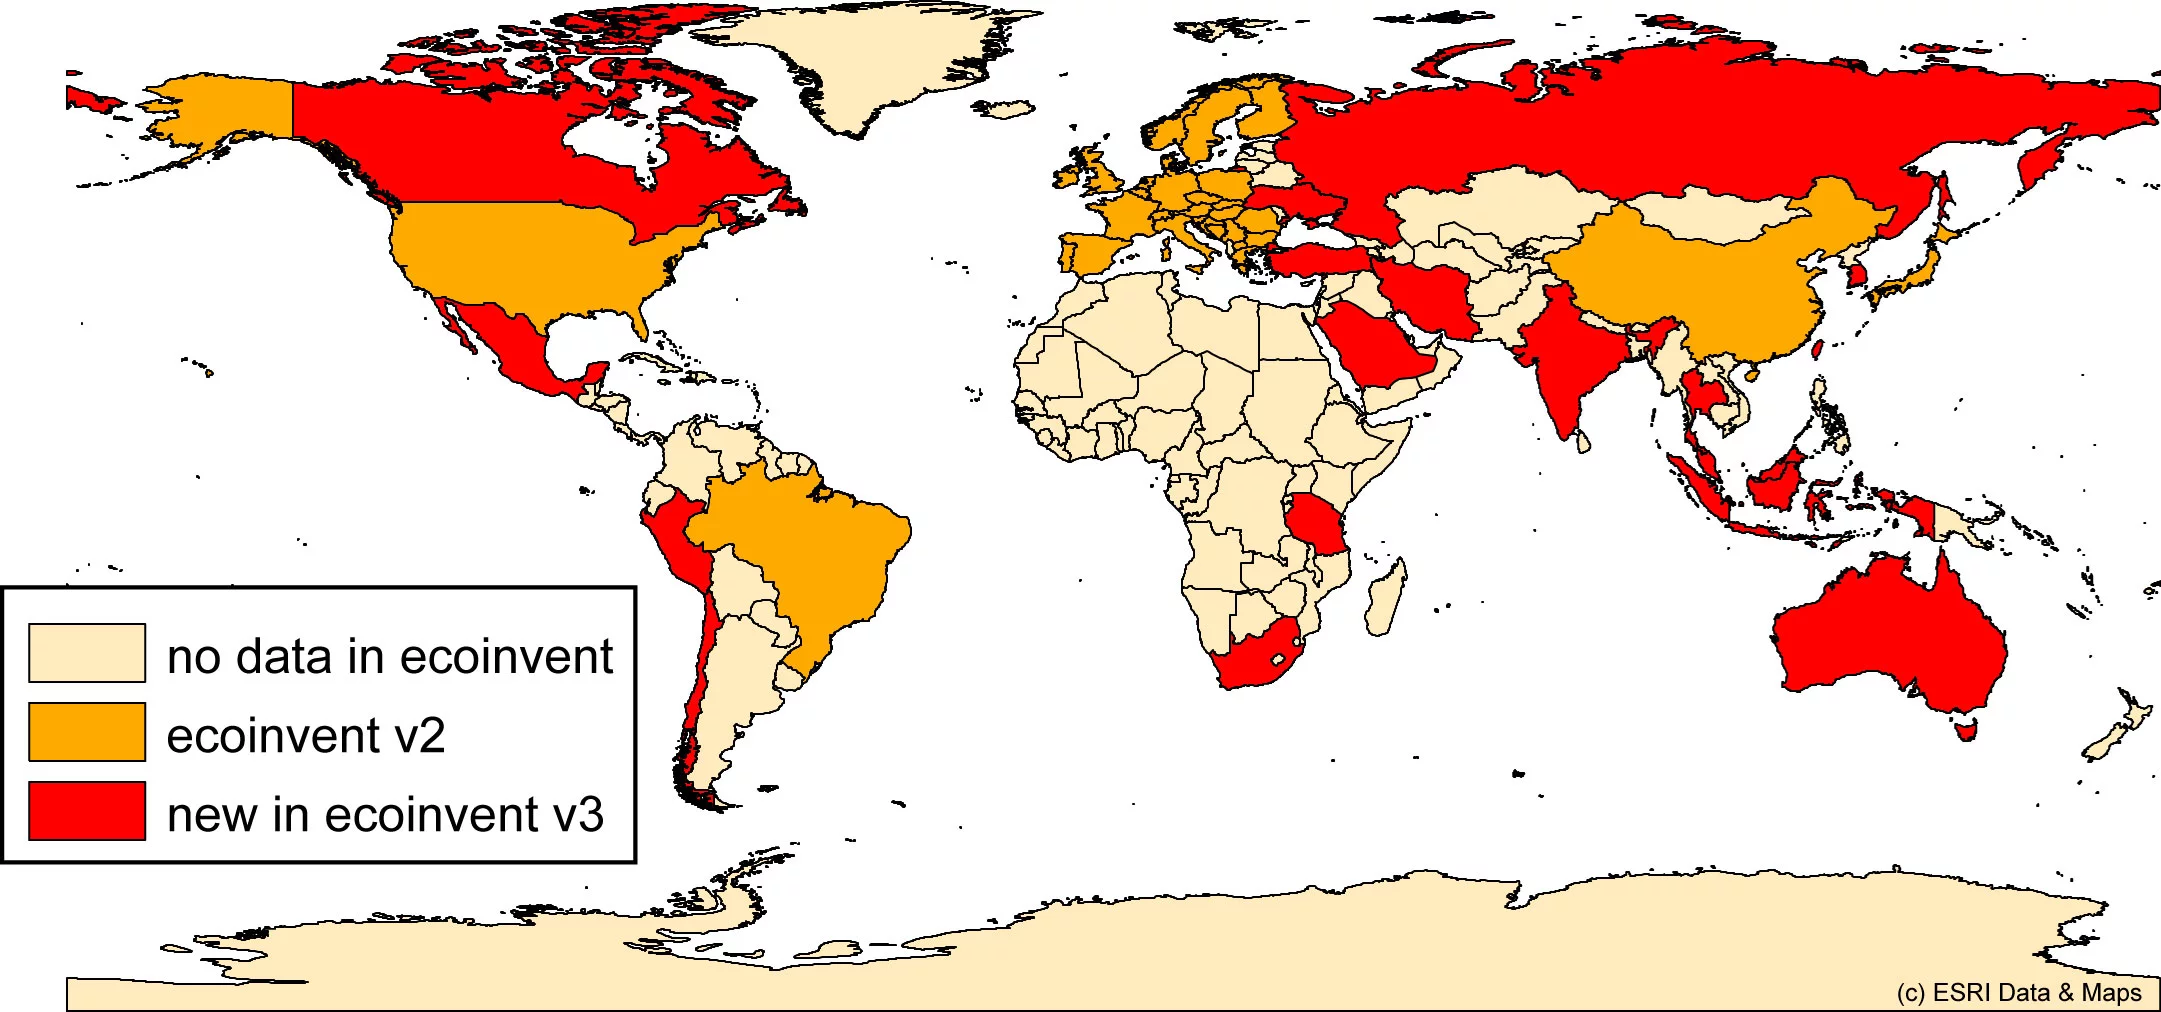
All countries contributing at least 1 per cent of the global electricity production are now included in the database. Instead of focussing on Europe, as has previously been the case, ecoinvent v3 now contains fifty countries on all continents. Consequently, the database covers 83 per cent of the global electricity production. Moreover, the data from the USA and Canada is now recorded on a regional level, which takes into account the sometimes extremely different regional conditions in such large countries. This now means that the ecological assessment of a product from the province of Quebec can be performed with more realistic data than was previously the case, for example. And last but not least, the new, higher geographic resolution enables consumers and retailers to replace general statements based on vague data with more precise, regional information. Canada is a prime example of major regional differences in large countries. It has provinces such as Quebec, which sustain themselves almost 100 per cent with renewable energy sources while the small territory of Nunavut is powered almost exclusively by crude oil.
Emissions from operating power grids
The database also enables the quantification of power losses and emissions that are associated with the transfer and distribution of power to the end consumer beyond the power stations. The ecological significance of the power grids thus becomes evident. For instance, you can keep a tally of nitrous oxide and ozone emissions produced in the vicinity of high-voltage overhead wires. The emission of sulphur hexafluoride, a substance that is primarily used as a flame retardant in switchgears and, according to the Intergovernmental Panel on Climate Change, constitutes the greenhouse gas with the highest global warming potential, is also recorded. Due to its low concentration in the atmosphere, sulphur hexafluoride is not a major driver of climate change. However, direct atmospheric measurements indicate a large increase in the global emissions of this long-lived gas.
One key difference in the database that brings interesting insights to light is between power generation and the electricity market. The former denotes the electricity produced in a geographic region, the latter refers to the electricity actually consumed in a geographic region. Through the influence of electricity imports, sometimes there can be considerable differences between a region’s production and consumption mixes. Take the small Canadian province of Prince Edward Island, for instance, where around 40 per cent of the electricity that comes out of the mains stems from coal, despite the fact there is not a single coal power station on the island. The coal power imports make this region, where up to 74 per cent of the electricity production consists of renewable energy sources, a fossil stronghold in terms of consumption. It is a different story in Denmark, where the inland power production mix is primarily based up to 70 per cent upon fossil energy sources but the power consumption mix only up to 53 per cent. The Danes chiefly owe this “greening” of their power mix to power imports from the hydropower stations in neighbouring Norway.
Better appraisal of technology
It is not only the geographic resolution that has improved in ecoinvent v3. The user can now evaluate power generation technology in a more differentiated manner.
For instance, the latest version of ecoinvent contains more detailed data with a higher regional resolution for wind power and photovoltaics, which displays how the location of a wind farm or solar power station can influence the life cycle assessment. For wherever there is often calm or fog, fewer kilowatt hours can be fed into the grid. The same goes for hydro and coal-fired power stations, which – depending on the local climate in the case of hydropower or technological upgrading for the purposes of efficiency or environmental protection in coal-fired power stations – more or less put a strain on nature.
How environmental pollution “hotspots” are detected
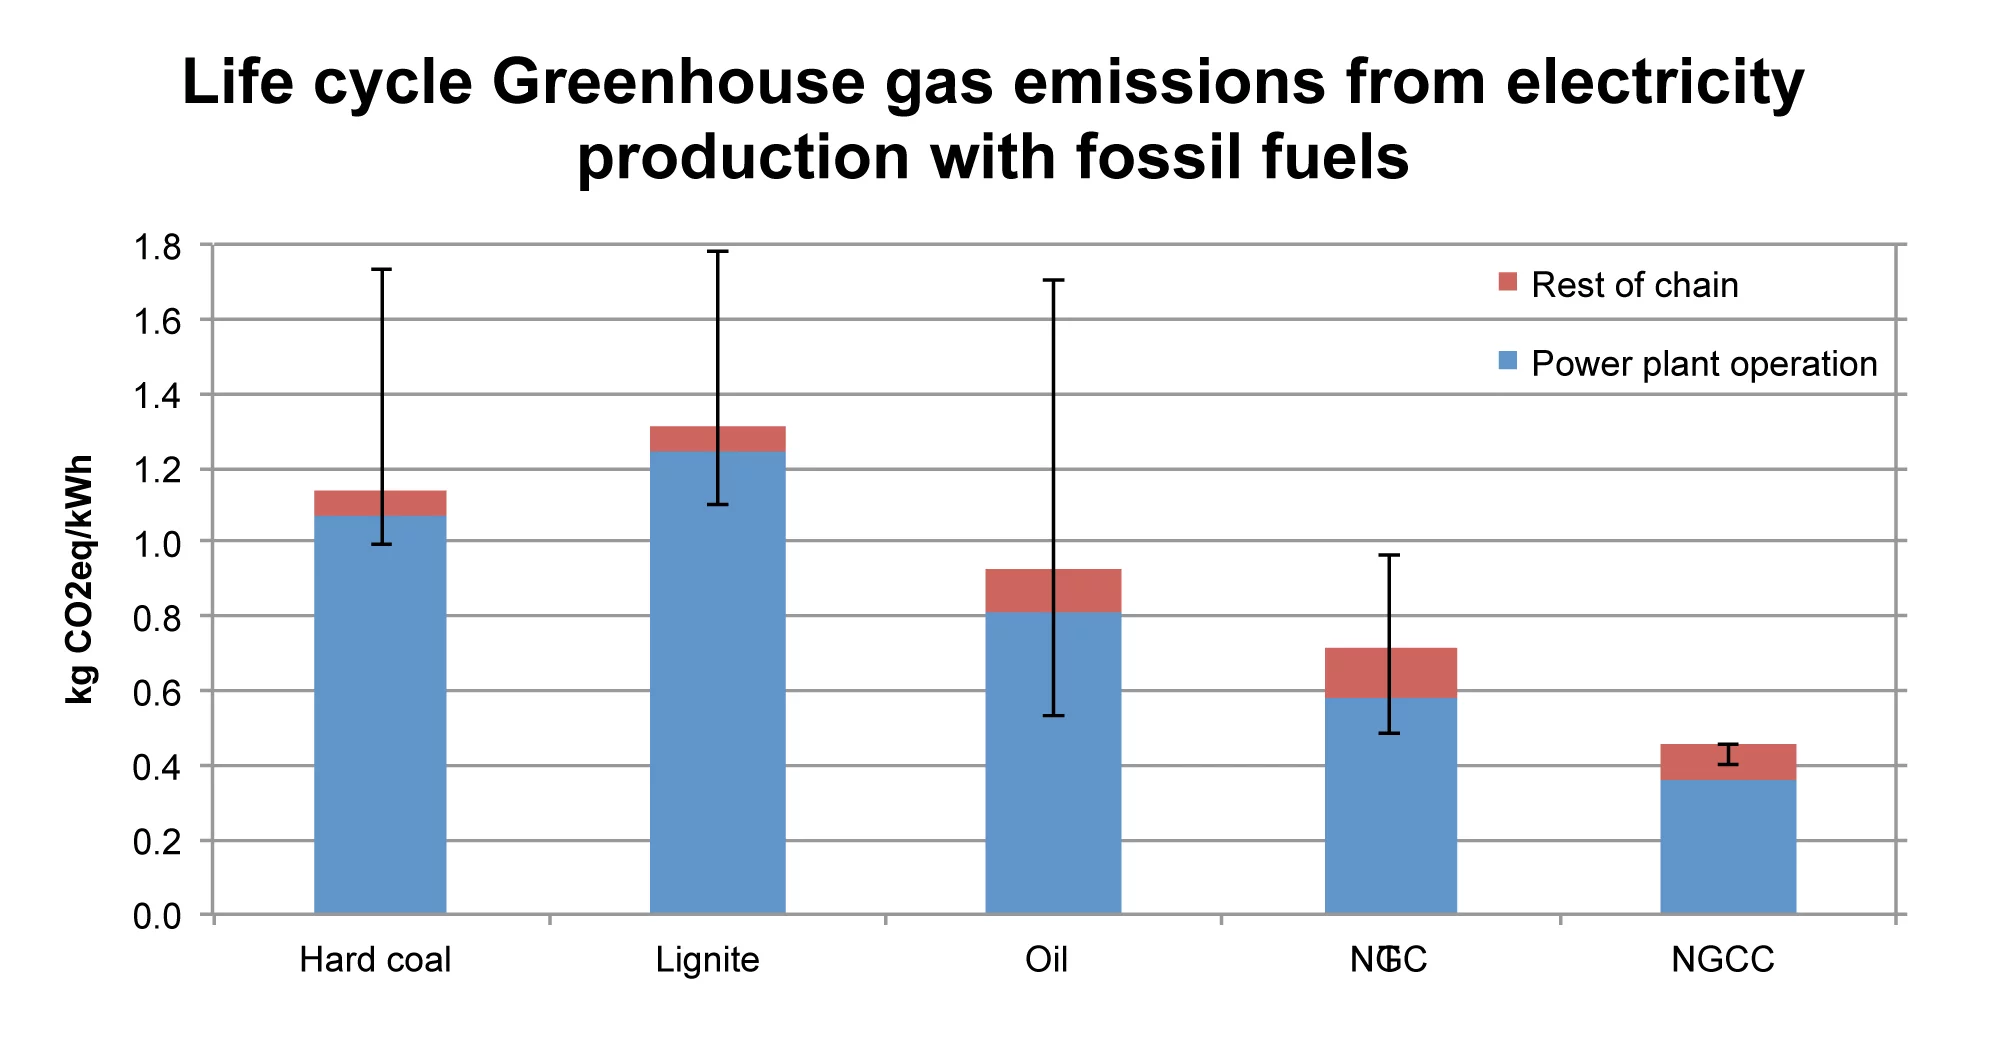
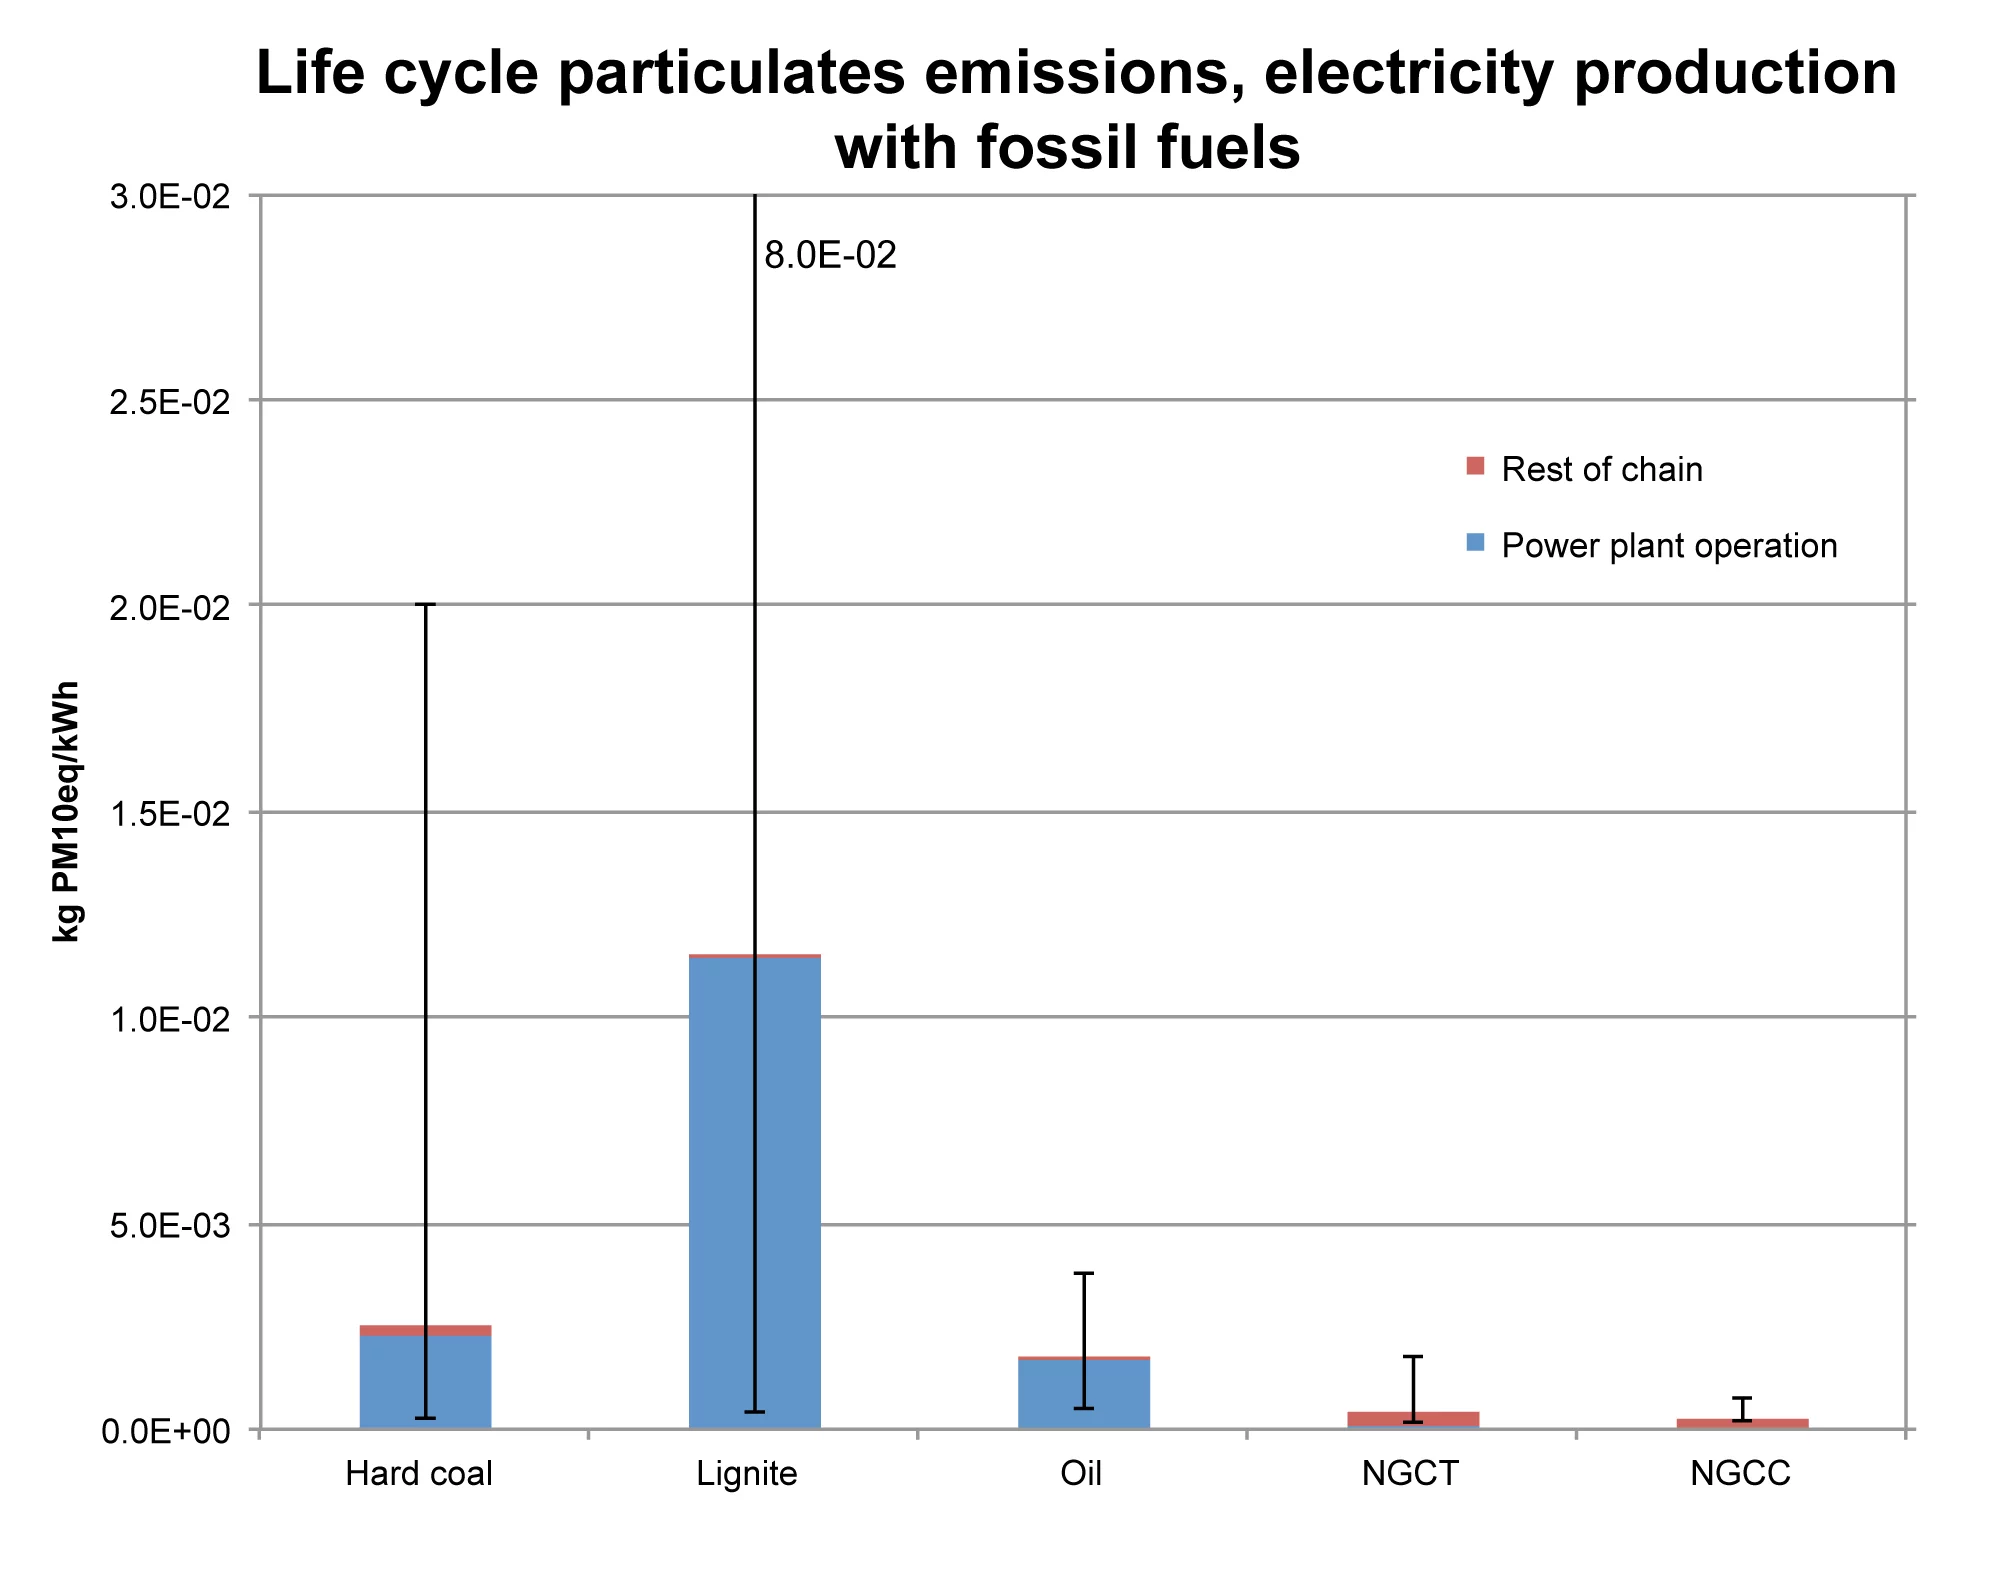
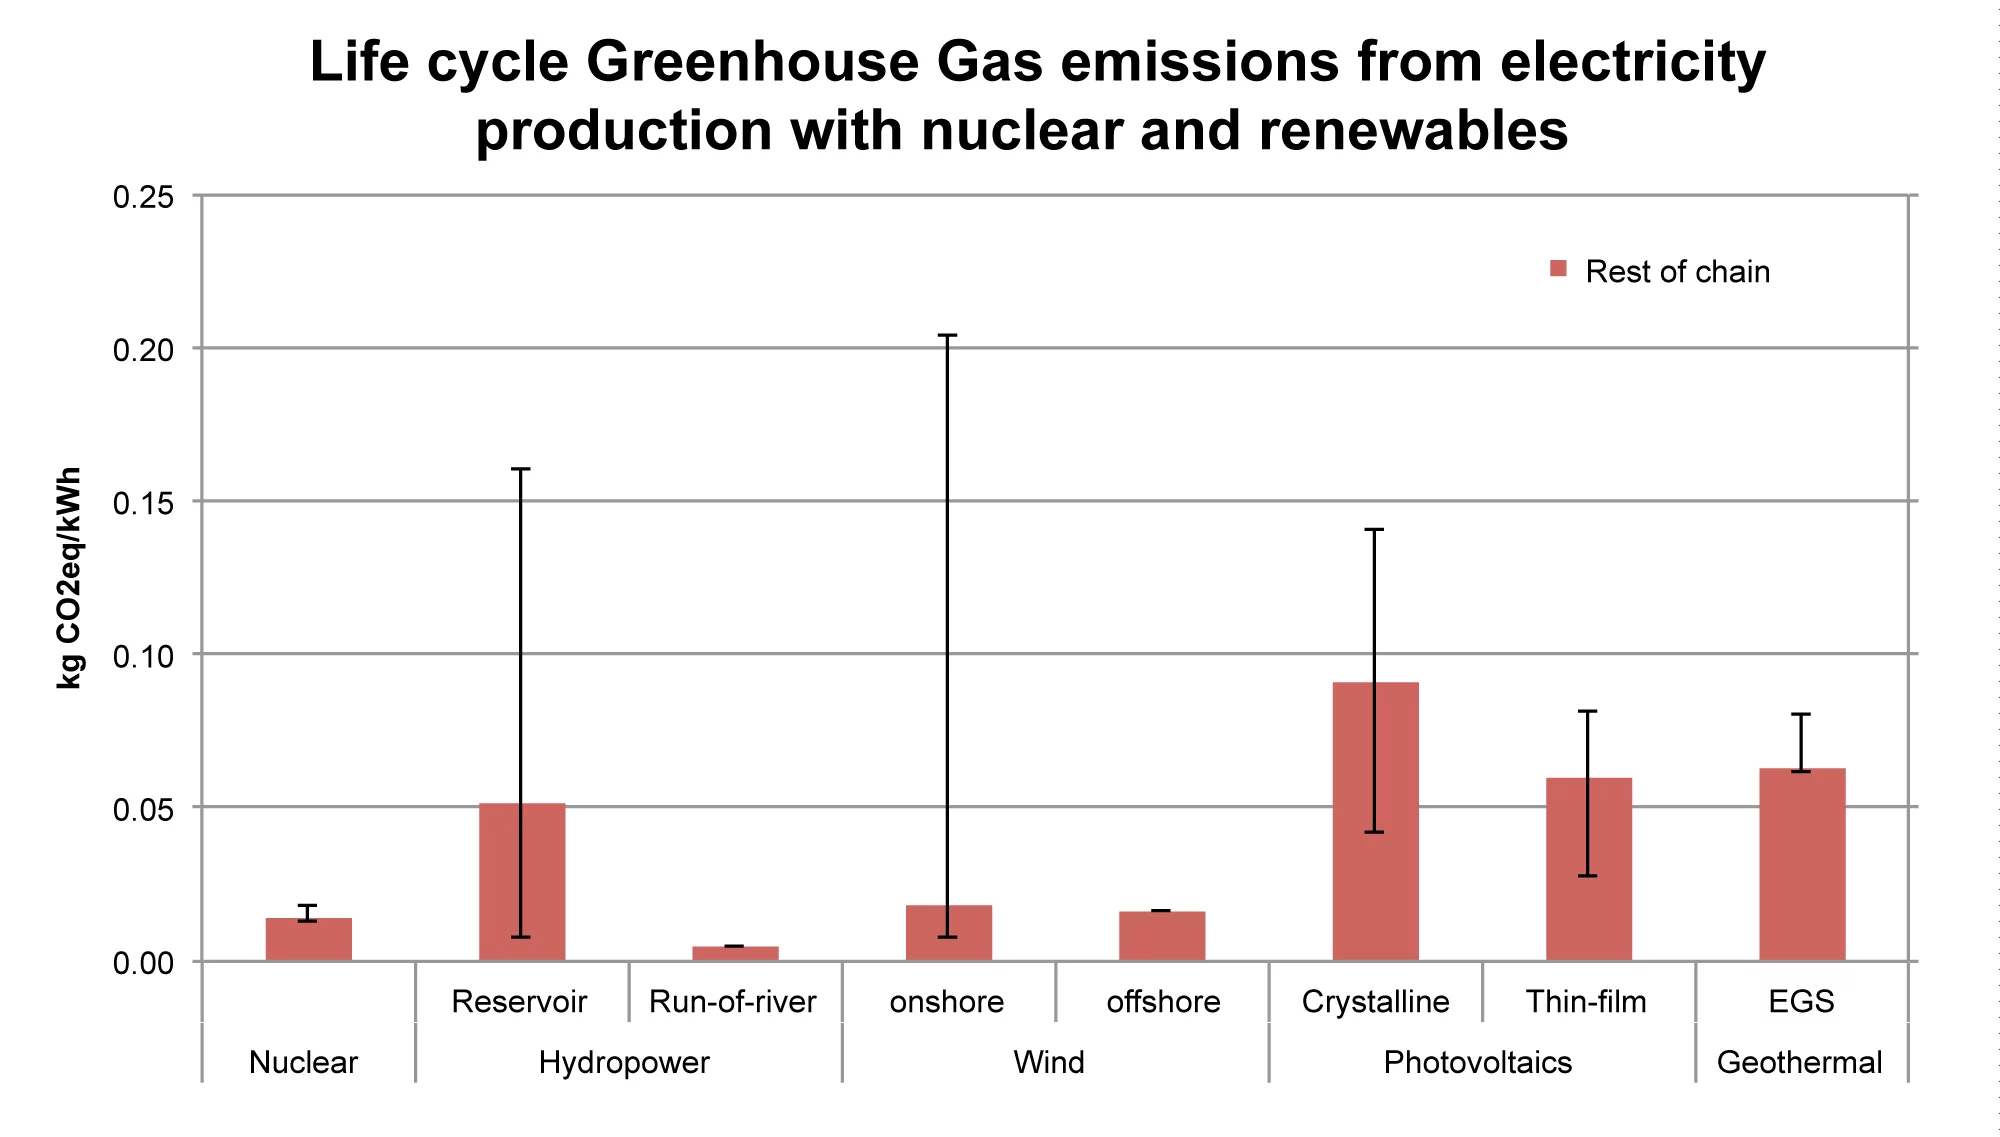
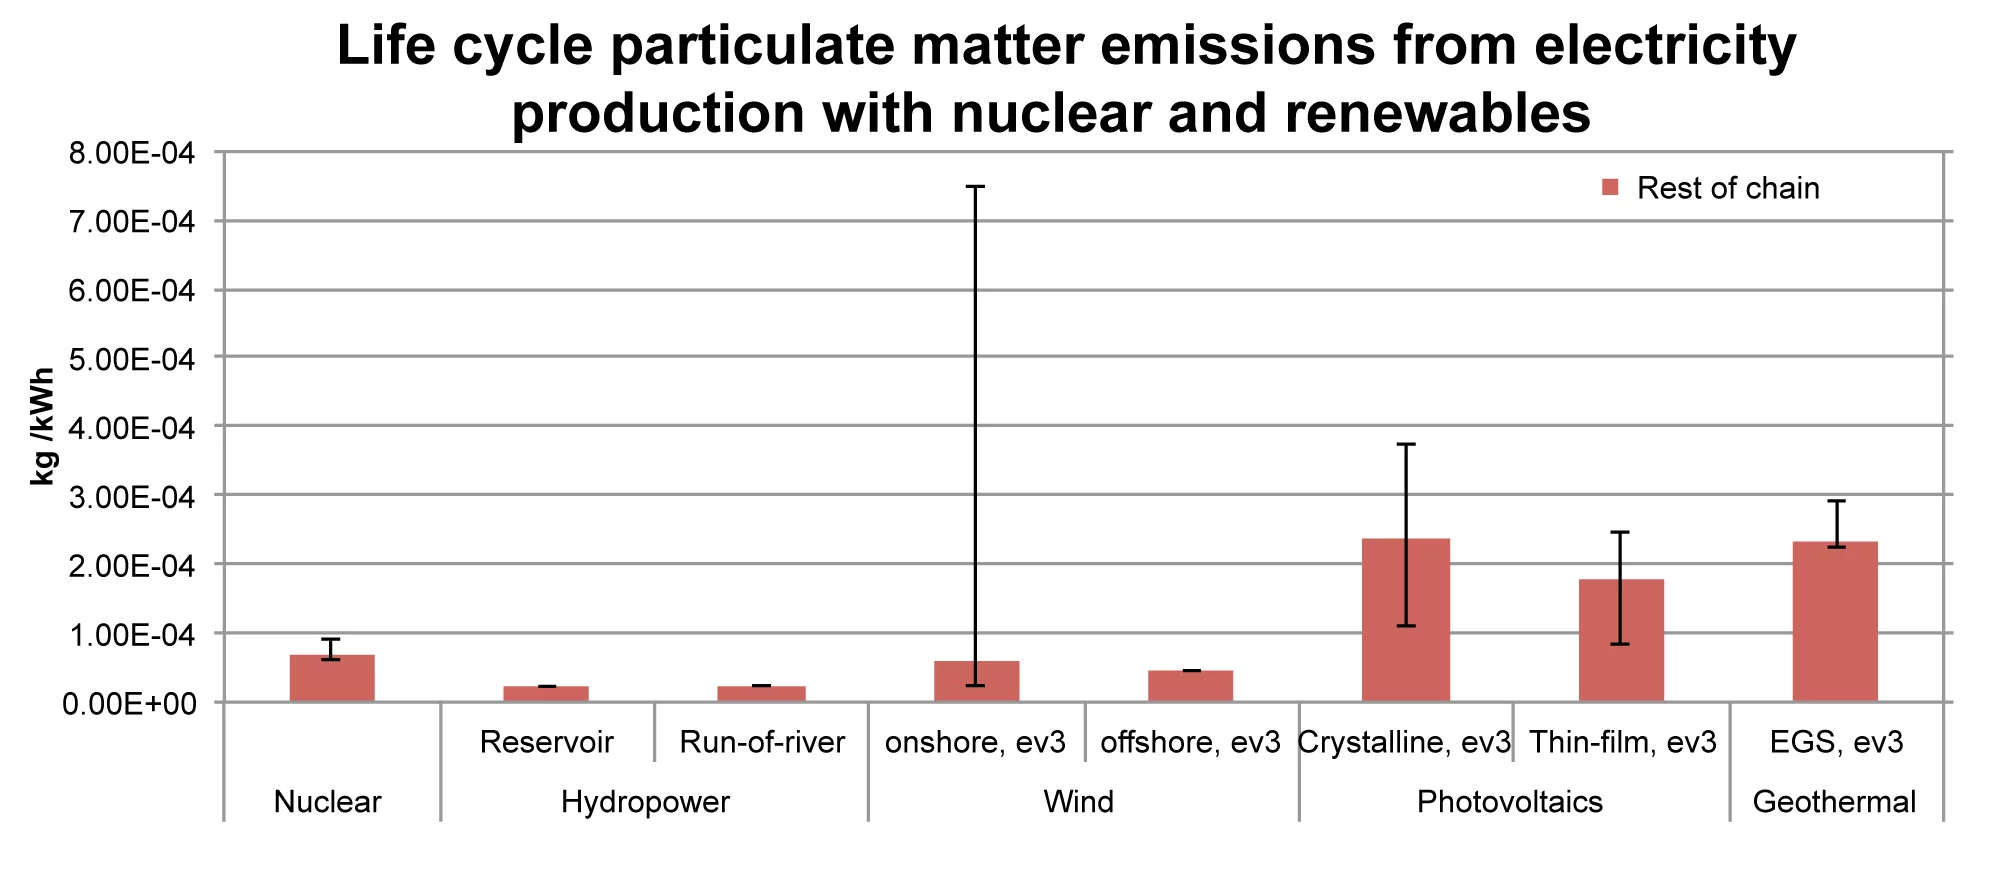
The results of a life cycle inventory also reveal where exactly the most environmental pollution occurs in the life cycle. While almost all greenhouse gas emissions stem directly from the chimneys during electricity production with coal, for instance, these emissions come almost exclusively from the construction of power stations and the associated consumption of material and energy in the case of renewable energies. Furthermore, the life cycle inventory for power from fossil fuels reveals that, in many cases, air pollution with fine particles cannot primarily be ascribed to direct particle emissions from chimneys, as has often been assumed. Instead, the delayed formation of fine particles through the transformation of nitric oxides and sulphur dioxide in the atmosphere plays a key role here. This is especially the case if the power stations are equipped with decent filters, as is commonplace in Europe, for instance.
Text: Paul Scherrer Institute/Leonid Leiva
Contact
Christian Bauer, Laboratory for Energy Systems Analysis, Paul Scherrer Institute,Telephone: +41 56 310 23 91, E-Mail: christian.bauer@psi.ch
Karin Treyer, Laboratory for Energy Systems Analysis, Paul Scherrer Institute,
Telephone: +41 56 310 57 45, E-Mail: karin.treyer@psi.ch [Deutsch, Englisch]
Original Publication
Life cycle inventories of electricity generation and power supply in version 3 of the ecoinvent database—part I:electricity generationKarin Treyer, Christian Bauer,
Int J Life Cycle Assess
DOI: 10.1007/s11367-013-0665-2
Life cycle inventories of electricity generation and power supply in version 3 of the ecoinvent database—part II:electricity markets
Karin Treyer, Christian Bauer,
Int J Life Cycle Assess
DOI: 10.1007/s11367-013-0694-x